
View, log, calibrate and configure all Impact Subsea sensors
seaView is an easy to use software package comprised of multiple applications (Apps) for viewing, logging, calibrating and configuring all Impact Subsea sensors.
Additional Apps within seaView allow specific tasks to be undertaken – such as Hydrographic Single Beam Echosounder Surveys or Flooded Member Detection.
seaView can connect to all Impact Subsea sensors – a single sensor can be connected to or multiple sensors simultaneously.
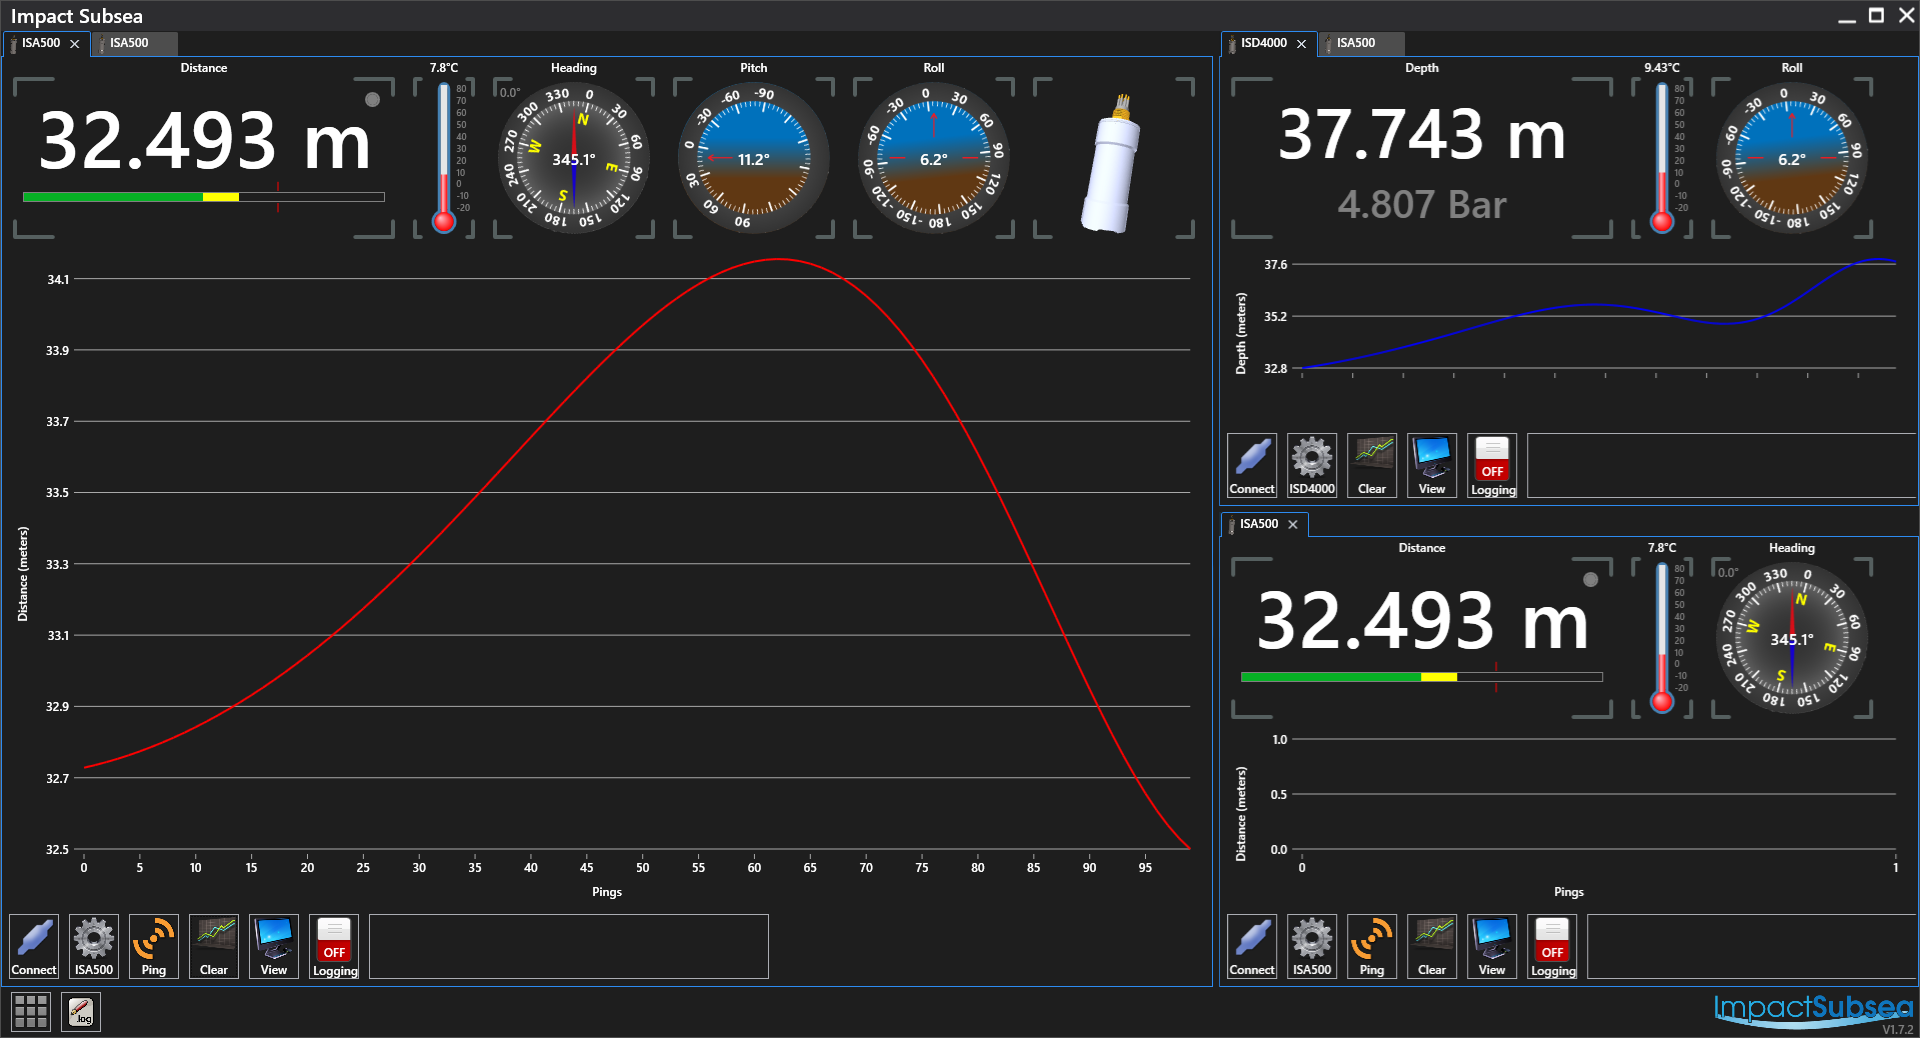
All data output from the sensors can be viewed on a single screen, or split across several screens.
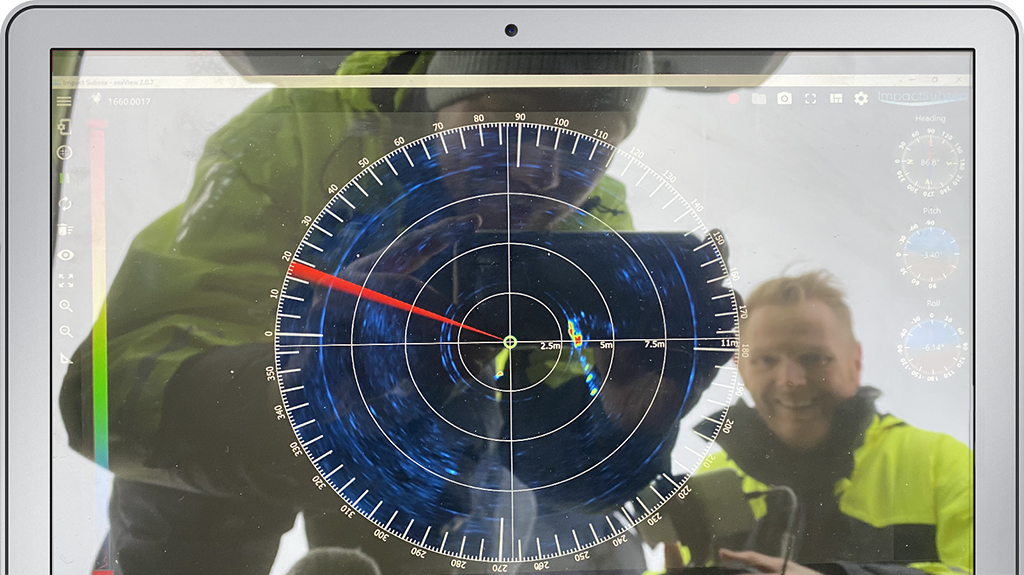
In the example seaView screen above, there are three sensors connected – two ISA500 units and one ISD4000 unit.
In addition to viewing live data, data can be logged for review at a later date or for post processing. All sensor data can be saved into a CSV file.
GPS can optionally also be input into seaView, allowing all data to be logged and georeferenced.
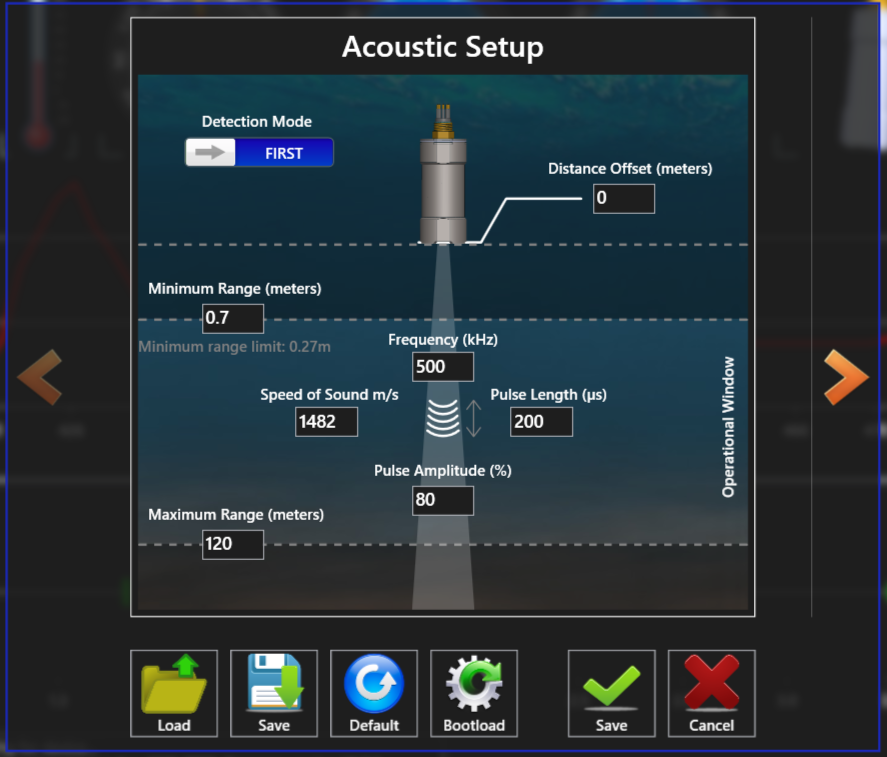
All Impact Subsea sensors can be configured via the seaView software. All settings are set on screen, then hard stored in the sensor flash memory.
In many cases, seaView is run only once – to initially setup a sensor for a particular mode of operation.
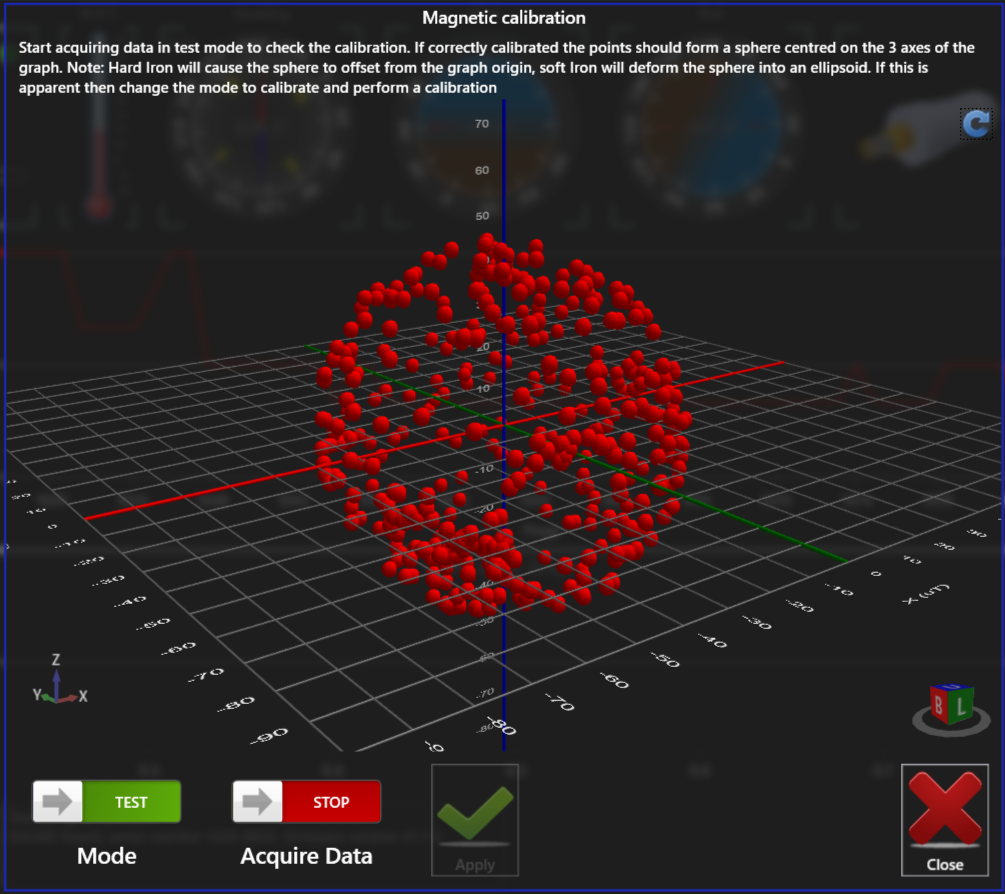
A heading calibration can be conducted on all sensors with integrated AHRS (Attitude & Heading Reference System). This will ensure that the sensors achieve exceptionally high heading accuracy, by taking into account hard and soft iron properties of their surrounding.
The ISA500 application provides all that is required to view and log data as well as configure and calibrate the ISA500 underwater Altimeter.
The main screen provides a graphic readout of the ISA500 Altitude/Range reading, Temperature, Heading, Pitch & Roll. A 3D graphic is provided of the ISA500 to tell at a glance the unit’s attitude.
A graph is located in the central screen, plotting each Altitude reading in real-time. A secondary graph can be opened, which shows all of the multi-echo data – ideal for thickness measurement or measuring the range to multiple targets.
Along the lower of the screen, buttons are provided for connecting to and configuring the ISA500. Further buttons allow the unit to be interrogated, the graph cleared, screen configured and logging turned on and off.
Learn more about the ISA500 sensor here.
The ISD4000 application provides all that is required to view & log data, configure and calibrate the ISD4000 underwater Depth & Temperature sensor.
The main screen provides a graphic readout of the ISD4000 Depth/Pressure reading, Temperature, Heading, Pitch & Roll. A 3D graphic is provided of the ISD4000 to tell at a glance the unit’s attitude.
A graph is located in the central screen, plotting depth reading in real-time.
Along the lower of the screen, buttons are provided for connecting to and configuring the ISD4000. Further buttons allow the graph to be cleared, screen configured and logging turned on and off.
Learn more about the ISD4000 sensor here.
The ISM3D application provides all that is required to view & log data, configure and calibrate the ISM3D underwater Heading, Pitch & Roll sensor.
The main screen provides a graphic readout of the ISM3D Heading, Pitch and Roll. A 3D graphic is provided of the ISM3D to tell at at glance the unit’s attitude.
A graph is located in the central screen, plotting Heading, Pitch and Roll. Each of these values can be turned on and off – ensuring the graph only shows the required data.
Along the lower of the screen, buttons are provided for connecting to and configuring the ISM3D. Further buttons to configure the graph and turn logging on and off are provided.
Learn more about the ISM3D sensor here.
Using the Flooded Member Detection (FMD) application within seaView, the ISA500 sensor can be used as a FMD probe.
The FMD application allows a representation of the underwater member to be produced on screen and samples taken and logged at user defined points.
The ISD4000 can also be used in the application to record the exact depth and temperature at each point a measurement is made.
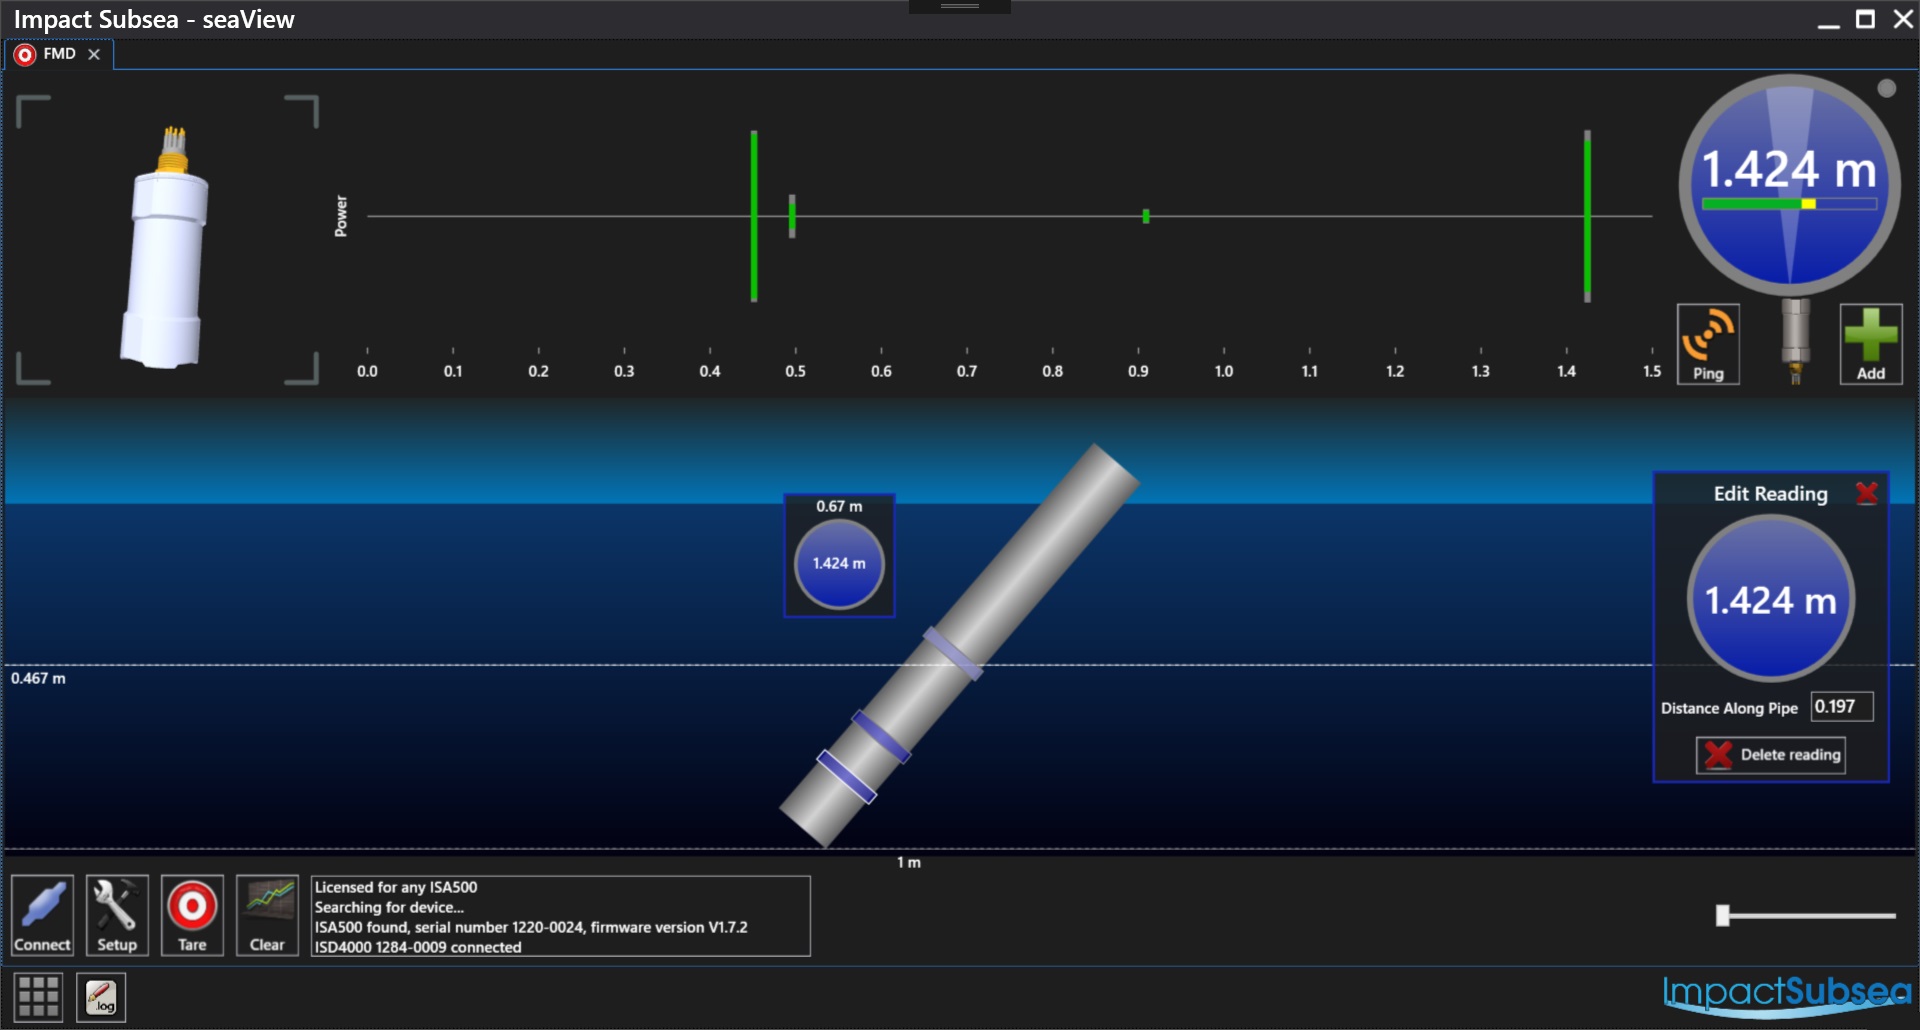
The Flooded Member Detection application provides all that is required to conduct an underwater Flooded Member Survey, using the ISA500 as a highly accurate and precise sensor probe.
The main screen shows the ISA500 sensor probe orientation, all echoes received together with a water level reading (if water is present).
A graphic representation of the underwater member being surveyed is user defined within the application. Measurements made along the underwater member are then recorded at defined points and shown visually on screen.
Upon completion of the survey, all data collected is saved and output in a Flooded Member Detection report.
The ISD4000 unit can also be used in conjunction with the ISA500 to record the depth of each measurement location.
Learn more about the ISA500 & FMD system here.
Please note – the FMD application requires a license key in order to operate – contact us to learn more.
seaView allows multiple sensors to be connected at the same time with each of their readings available to view and log.
Customise how to view the data – tab sensors, have them side by side and turn off any items you do not need to see.
Check out the video below for an example of an ISA500 Altimeter with AHRS together with an ISD4000 Depth and Temperature sensor with AHRS running at the same time in seaView.


