seaView is an easy to use software package comprised of multiple applications (Apps) for viewing, logging, calibrating and configuring all Impact Subsea sensors.
Data from multiple sensors can be displayed on screen in real-time, providing a powerful user interface for operations with multiple sensing requirements (such as ROV operations).
Additional Apps within seaView allow specific tasks to be undertaken – such as Flooded Member Detection.
With V3 comes the ability to automatically detect any sensor that has been physically connected to the computer.
V3 allows single or multiple Impact Subsea sensors to operate simultaneously from a single application.
This is ideal for operations with a single sensor to ROV operations where Sonar, Altitude, Depth, Heading, Pitch & Roll can all be displayed on screen at the same time.
seaView 3.1 also allows video support. Users can now directly view and record video streams from any connected video camera within the software.
seaView 3.1 introduces a powerful global logging and replay functionality. This feature enables users to record data from multiple sensors simultaneously into a single file.
The recorded data can then be conveniently replayed within seaView, ensuring all sensor readings remain synchronised for in-depth analysis.
All sensor data can be saved into a configurable CSV file.
GPS can optionally also be input into seaView, allowing all data to be logged and georeferenced.
All Impact Subsea sensors can be configured via the seaView software. All settings are set on screen, then hard stored in the sensor flash memory.
In many cases, seaView is run only once – to initially setup a sensor for a particular mode of operation.
All sensors are fully software configurable, with seaView V3 providing a clear process to set up and configure sensors to suit specific requirements.
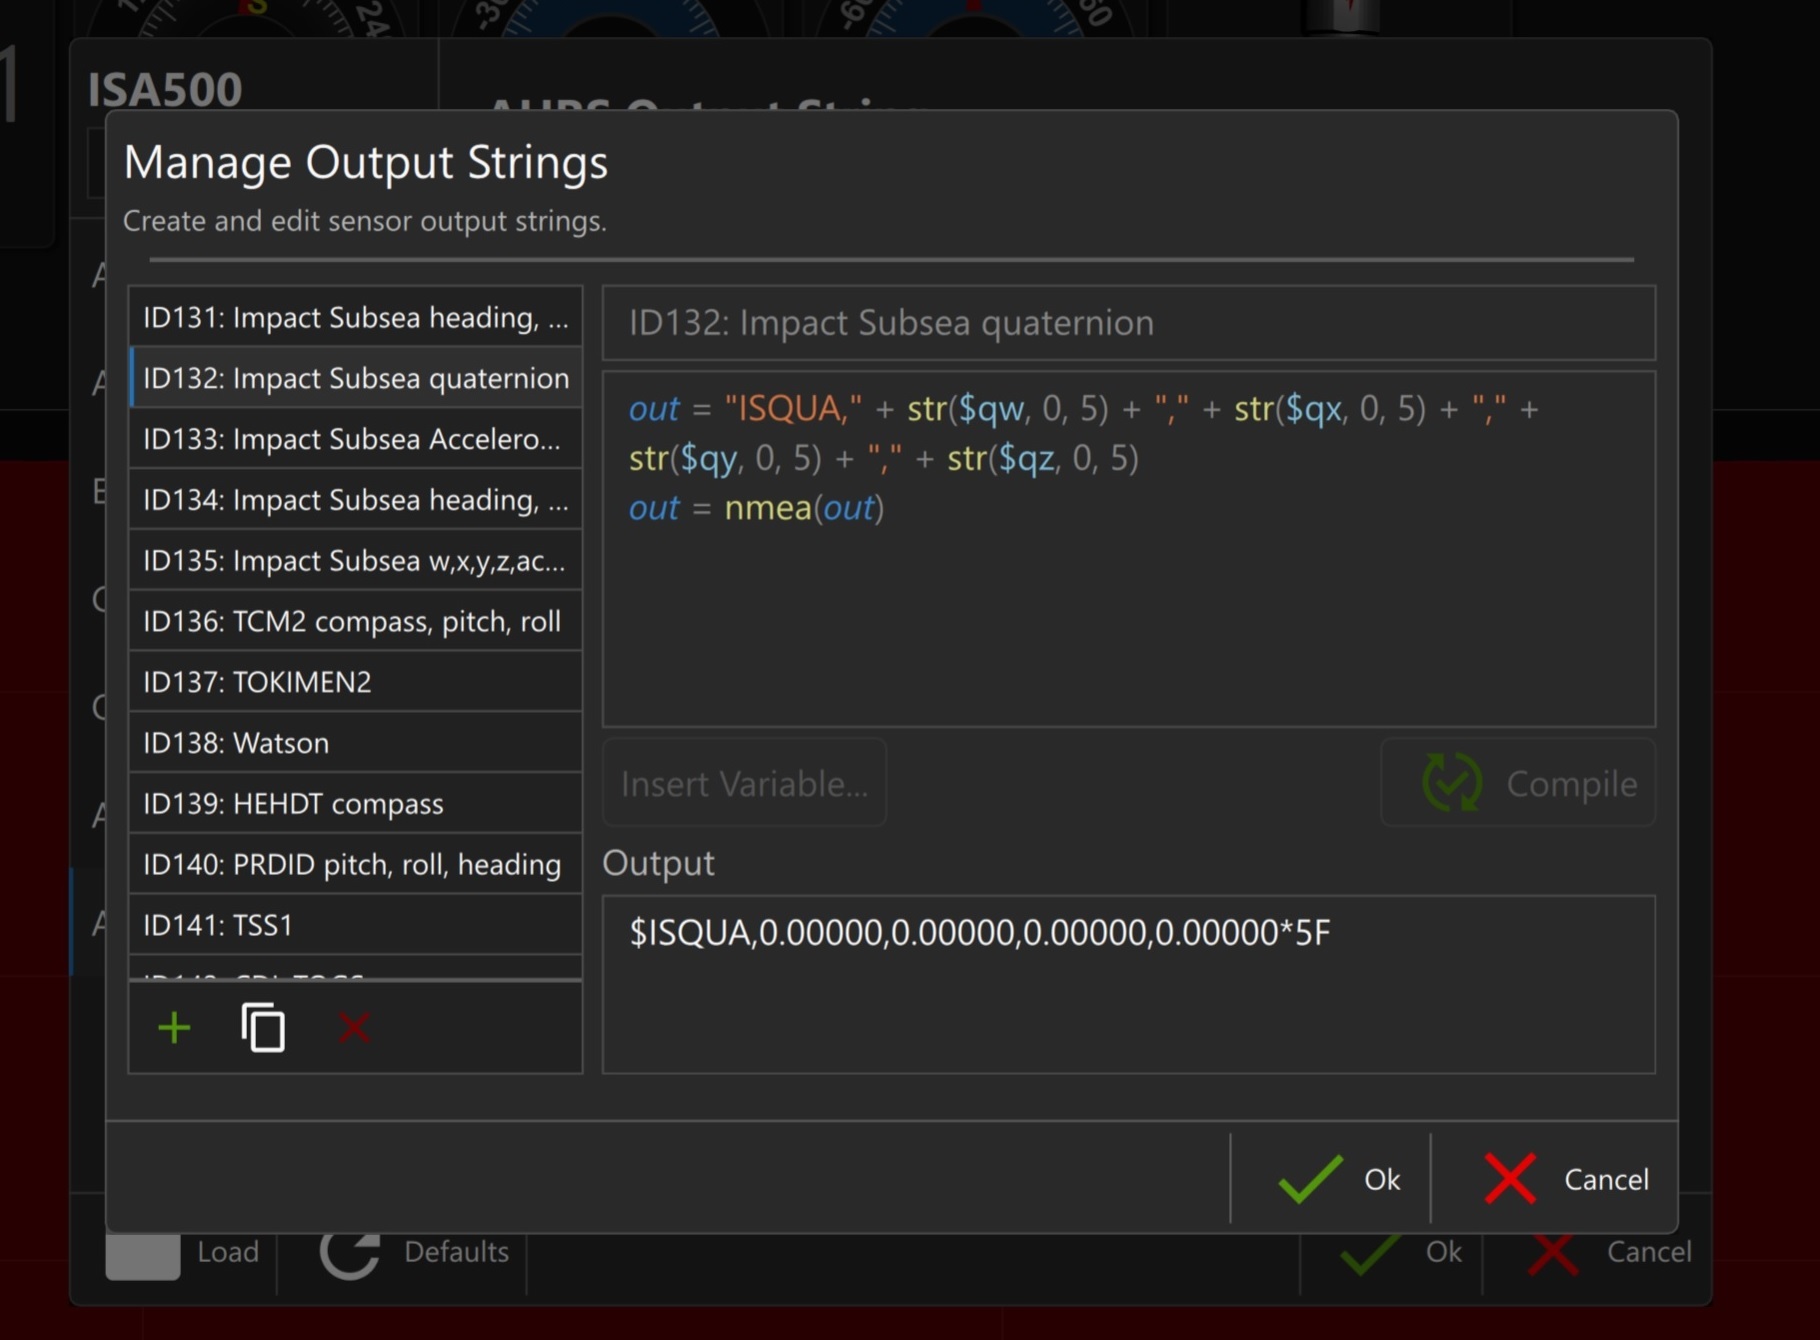
V3 allows for custom output strings to be created, where users can add new formats of ASCII output strings to a sensor’s firmware.
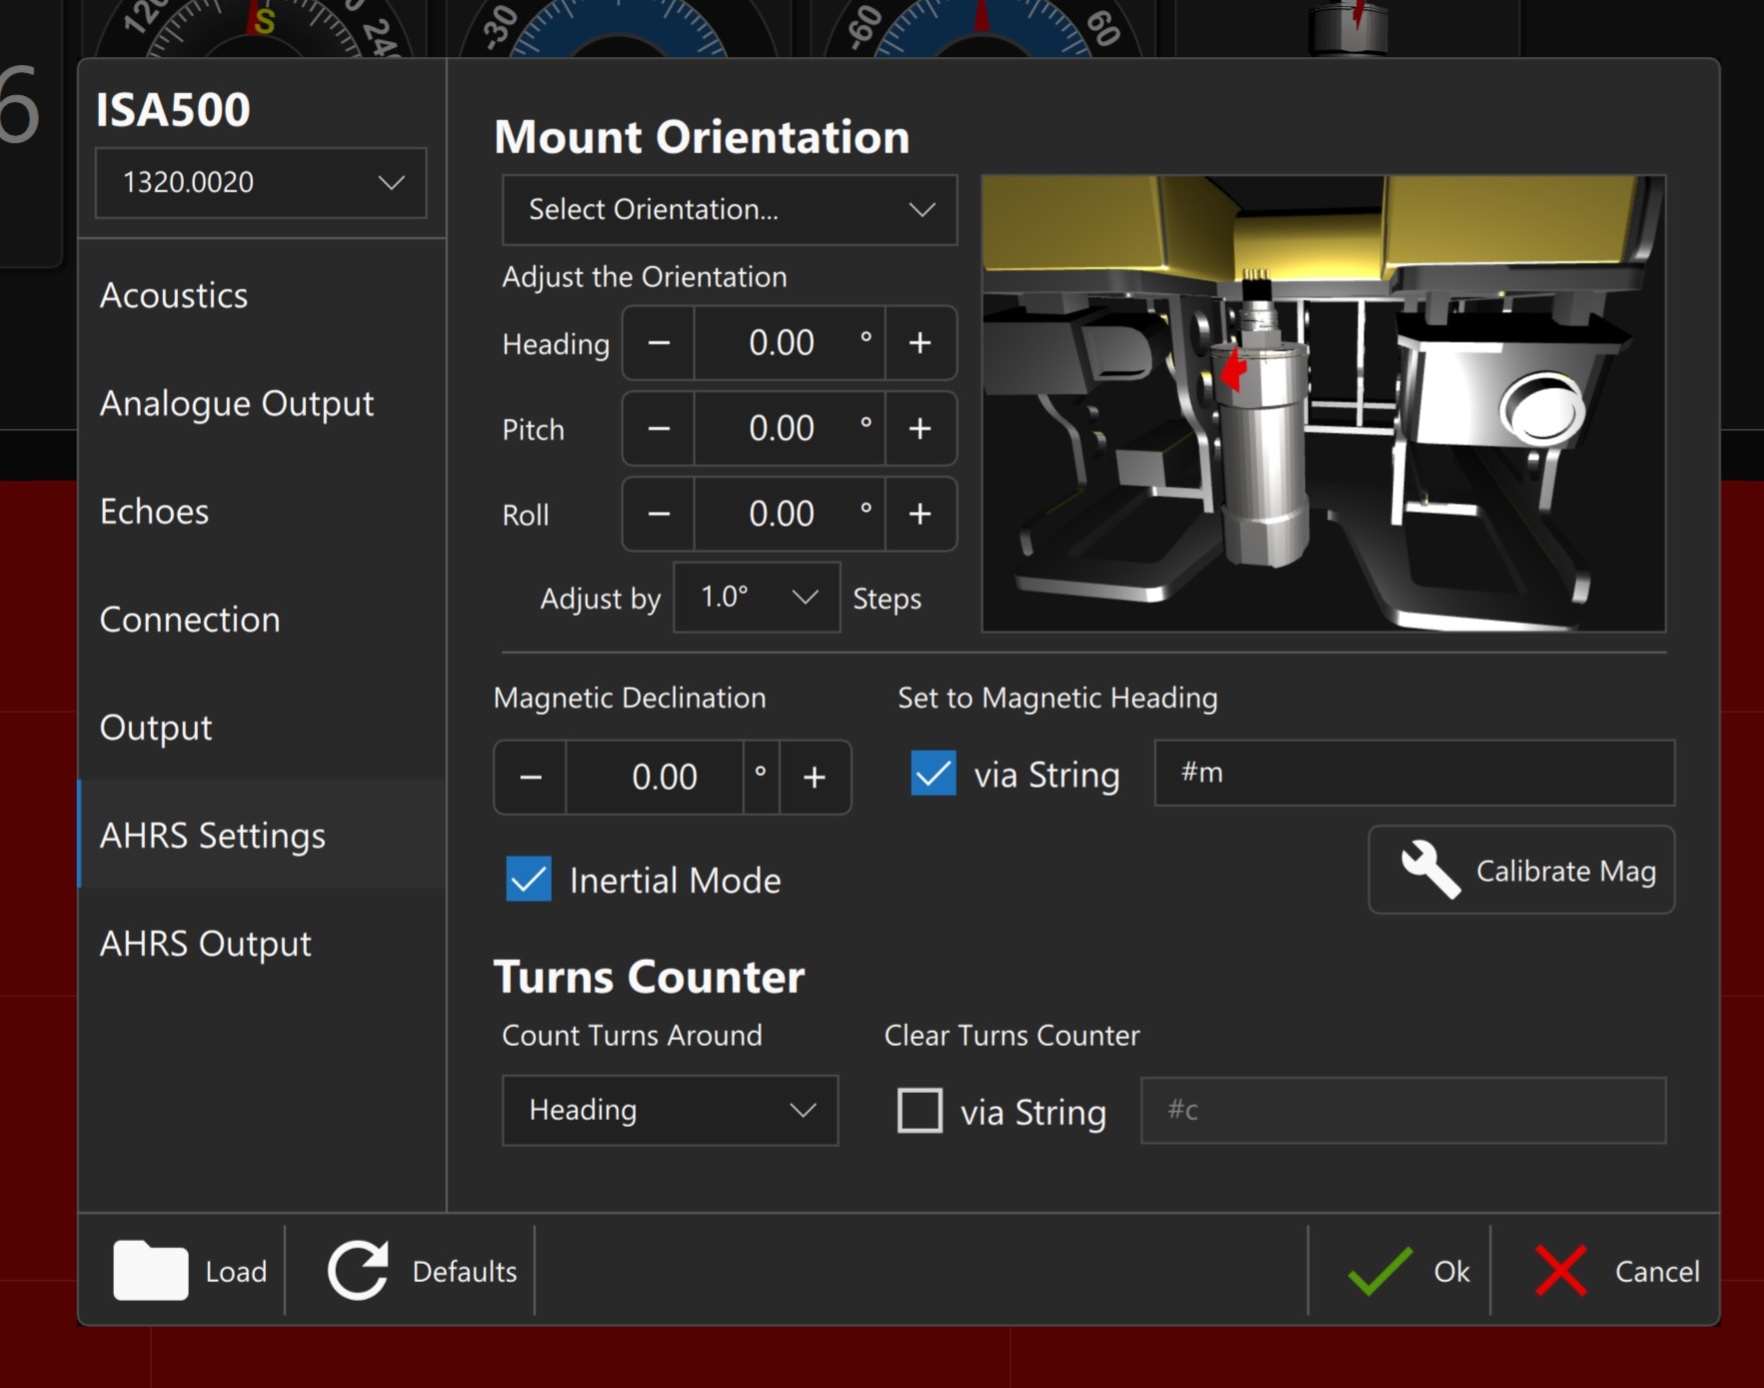
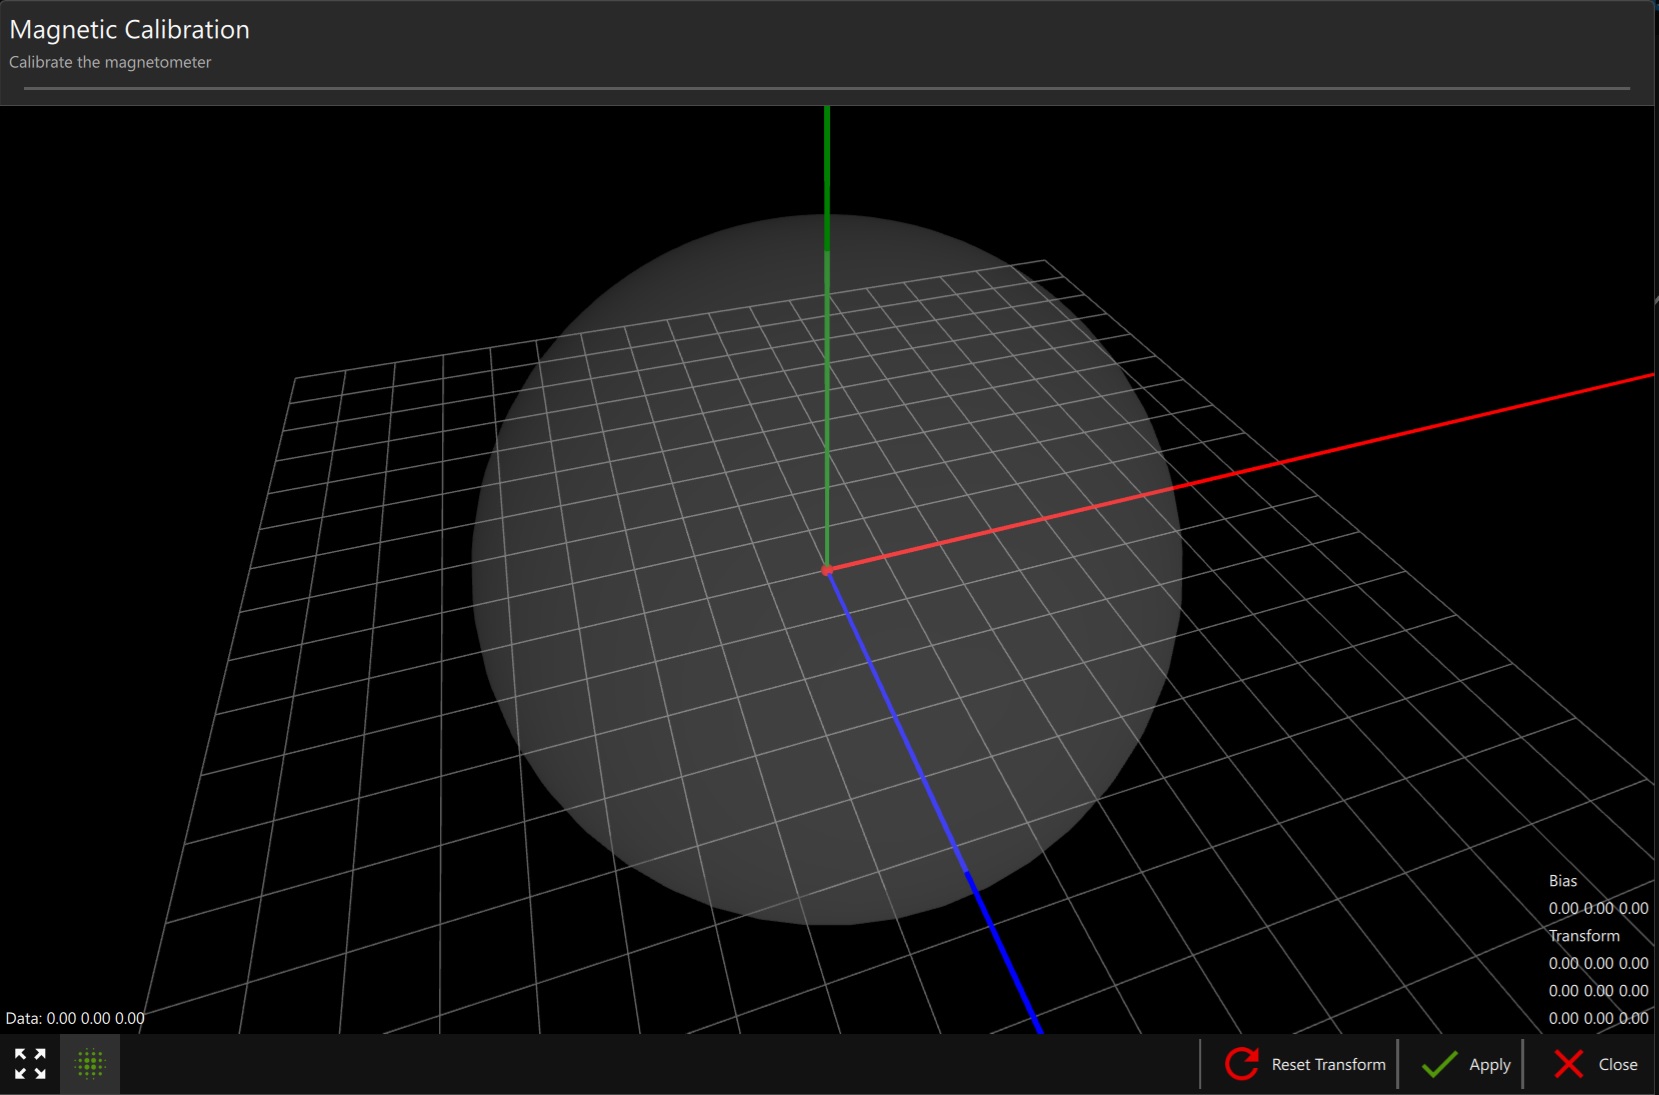
A heading calibration can be conducted on all sensors with integrated AHRS (Attitude & Heading Reference System). This will ensure that the sensors achieve exceptionally high heading accuracy, by taking into account hard and soft iron properties of the surrounding area.
The ISS360 application provides all that is required to view and log data as well as configure the ISS360 imaging sonar.
The main screen provides a graphic readout of the ISS360 sonar display. On the right hand side of the screen, if integrated, the pitch and roll readings will be seen. A 3D graphic is also provided to show, at a glance any motion experienced by the sonar.
At the bottom of the screen, buttons are provided to configure gain, range and resolution adjustments.
On the left side of the screen, there is a colour chart to allow changes to the sonar display, colour palette. This chart also allows users to make visual adjustments to the detection threshold and image contrast.
Further buttons, on the left side, allow for setup of acoustics, connection, pitch and roll. There are also options available to allow for sector scanning, rather than the full 360° field of vision. Marker points can be added along with the ability to measure between them.
Learn more about the ISS360 sensor here.
The Profiling Sonar software application, part of the Impact Subsea seaView software suite, allows users to operate, visualise and log data from Impact Subsea ISP360 profilers.
SeaView provides a user-friendly interface with key features like automatic sensor detection, real-time data visualisation and intuitive controls. Users can adjust scanning parameters such as sector width, range and frequency, as well as control gain, resolution and data filtering.
The software offers various display options, including raw data, processed imagery and overlaid grids and measurements. Users can also configure data output to external systems for further analysis and integration with other survey equipment.
The Profiling Sonar application provides a robust and versatile tool for underwater inspection and surveying tasks, enabling users to efficiently collect and analyse high-resolution profiling data.
Learn more about the ISP360 sensor here.
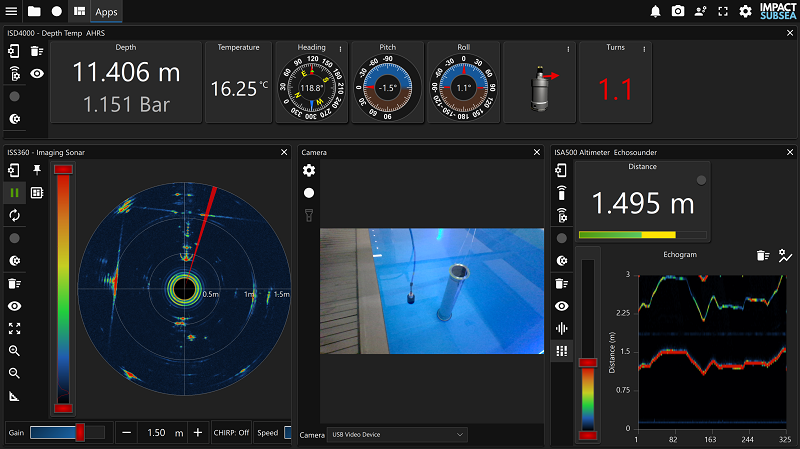
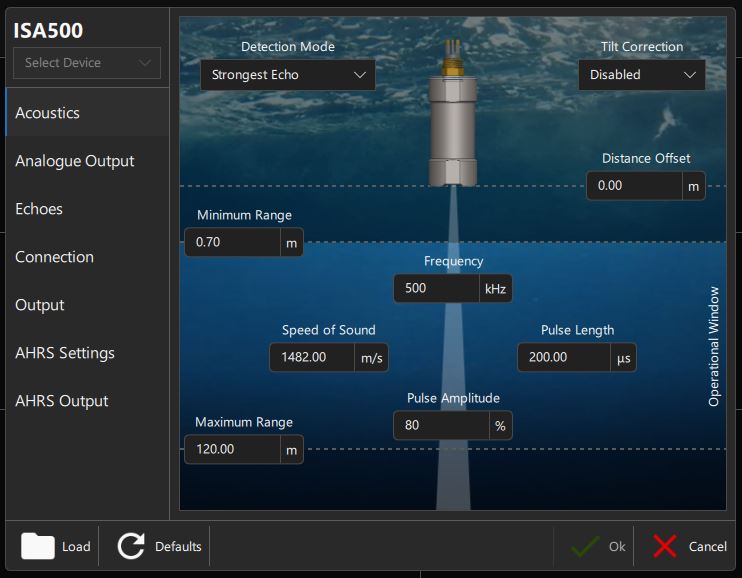
The ISA500 application provides all that is required to view and log data as well as configure and calibrate the ISA500 underwater Altimeter.
The main screen provides a graphic readout of the ISA500 Altitude/Range reading, Temperature, Heading, Pitch & Roll. A 3D graphic is provided of the ISA500 to tell at a glance the unit’s attitude.
A graph is located in the central screen, plotting each Altitude reading in real-time. A secondary graph can be opened, which shows all of the multi-echo data – ideal for measuring the range to multiple targets.
On the left side of the screen, buttons are provided to configure the ISA500. Further buttons allow the unit to be interrogated, the graph cleared, screen configured and logging turned on and off.
Learn more about the ISA500 sensor here.
The ISD4000 application provides all that is required to view & log data, configure and calibrate the ISD4000 underwater Depth & Temperature sensor.
The main screen provides a graphic readout of the ISD4000 Depth/Pressure reading, Temperature, Heading, Pitch & Roll. A 3D graphic is provided of the ISD4000 to tell at a glance the unit’s attitude.
A graph is located in the central screen, plotting depth reading in real-time.
On the left side of the screen, buttons are provided to configure the ISD4000. Further buttons allow the graph to be cleared, screen configured and logging turned on and off.
Learn more about the ISD4000 sensor here.
The ISM3D application provides all that is required to view & log data, configure and calibrate the ISM3D underwater Heading, Pitch & Roll sensor.
The main screen provides a graphic readout of the ISM3D Heading, Pitch and Roll. A 3D graphic is provided of the ISM3D to tell at at glance the unit’s attitude.
A graph is located in the central screen, plotting Heading, Pitch and Roll. Each of these values can be turned on and off – ensuring the graph only shows the required data.
On the left side of the screen, buttons are provided to configure the ISM3D. Further buttons to configure the graph and turn logging on and off are provided.
Learn more about the ISM3D sensor here.
Using the Flooded Member Detection (FMD) application within seaView, the ISA500 sensor can be used as a FMD probe.
The FMD application allows a representation of the underwater member to be produced on screen and samples taken and logged at user defined points.
The ISD4000 can also be used in the application to record the exact depth and temperature at each point a measurement is made.
The Flooded Member Detection application provides all that is required to conduct an underwater Flooded Member Survey, using the ISA500 as a highly accurate and precise sensor probe.
The main screen shows the ISA500 sensor probe orientation, all echoes received together with a water level reading (if water is present).
A graphic representation of the underwater member being surveyed is user defined within the application. Measurements made along the underwater member are then recorded at defined points and shown visually on screen.
Upon completion of the survey, all data collected is saved and output in a Flooded Member Detection report.
The ISD4000 unit can also be used in conjunction with the ISA500 to record the depth of each measurement location.
Learn more about the ISA500 & FMD system here.
Please note – the FMD application requires a license key in order to operate – contact us to learn more.
Learn more about the ISFMD System here.
seaView allows multiple sensors to be connected at the same time with each of their readings available to view and log.
Customise how to view the data – tab sensors, have them side by side and turn off any items you do not need to see.
The screen image above shows the ISS360 Sonar running on the right hand side, the ISD4000 Depth Sensor top left, ISM3D AHRS sensor middle left and the ISA500 Altimeter lower left.
The Impact Subsea Academy is a help center and knowledge base. It has been set up for you to be able to search for articles on anything from your first steps to the most advanced features.

